Maricopa County has a GIS election system that the up-to-date status of votes at any time. Could this have been used to record and manipu...

Maricopa County has a GIS election system that the up-to-date status of votes at any time. Could this have been used to record and manipulate vote results?
Maricopa’s real-time visibility into ballots is just mind-boggling. It doesn’t just recognize when completed ballots are received. It can map every voter location for ballots that have passed the signature verification process. This is a true reflection of what will be tabulated. It can show areas of low or high turnout, by party, Spanish-only ballots, or just about any other criteria. Their public interactive map currently shows 2020 returns by precinct, political party, and demographics including race and age. The (UOCAVA) map of overseas voters shows the entire world including China (145 votes), Pakistan (3), India (108), etc.

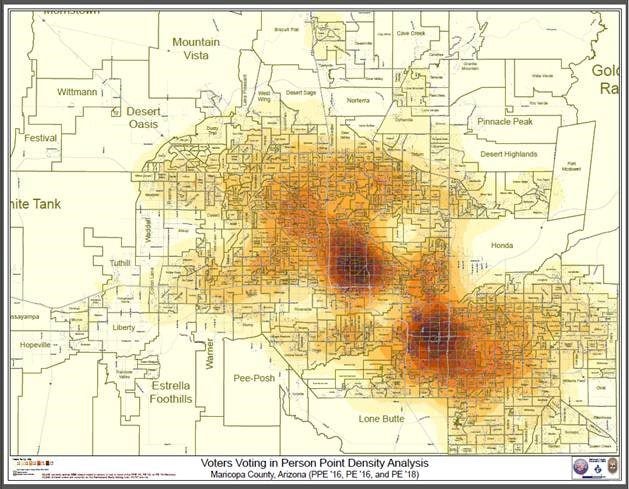
The below “heat map” is another real example from the GIS department. The dots are ballots cast. It shows Dems who voted “in-person” during the primaries. Maricopa used this to determine the best locations to add new “voting centers” for the 2020 election. No other parties were layered in the map, just Dems.
DemVotersVotingInPersonDensityPPE16 PE16 PE18 (2) by Jim Hoft on Scribd
Maricopa has conducted accurate geocoding of every registered voter in the county. We are all just an x, y coordinate now:). Maricopa will process any map request at a rate of $40/hr. If the map already exists, then it’s free. At one time they had over 1,100 PDF election maps in their online library. But the public is now directed to the interactive map with (EV) Early Voting returns, or the one without. The “Elections Department Only” and powerful Desktop versions used by internal staff can access individual voter information, and much more.

Imagine how powerful this data would be in the wrong hands, in the days leading up to election day, or while they’re still tabulating afterward. It would be invaluable to know all registered voters who were mailed a ballot, don’t have a completed one in the system, and haven’t voted in the last two elections. These “unused” votes are what nefarious actors want. Targeted data showing exact locations would be a goldmine for ballot harvesters too. The advanced real-time features are simply portrayed as helping “Get out the Vote” initiatives.
The GIS map below has plotted all Maricopa Democrats who voted “in-person” for the previous two primaries. This “heat map” was used by the County to determine the best locations for new “Vote Centers” in 2020. Vote Centers allow anyone to show up and vote. It’s a departure from precinct-based voting because it’s easier to hide bogus ballots and illegal voters.

The mapping technology they use is from ESRI, a 50-year-old company with 9,000 employees. ESRI now has products directly targeting elections and some are provided free to nonprofits. The hard-left organization Democracy Labs advocates for BLM and similar ideologies. They have been using ESRI to create tools for their activist partners. VoterPac used it to track down unregistered voters in CA counties where Devin Nunes and Kevin McCarthy reside. They mapped zip codes, census tracts, and block group codes, and so on. They included more personal datasets to pinpoint their targets: attended any school meetings, volunteer at a charity, signed petitions, wrote or called a politician, voted in the last 12 months, and more.
You can expect Big Tech and their Big Data Analytics partners are light years beyond this. In fact, the left-leaning Democracy Works has already partnered with USPS, directly integrating into their systems to monitor the real-time movement of ballots. It’s just a few regions so far, but it should stop. There is truly no good reason for anyone to have this level of bulk ballot data in real-time, before an election.